Wyoming Ranked 2nd Worst State for Teen Drivers
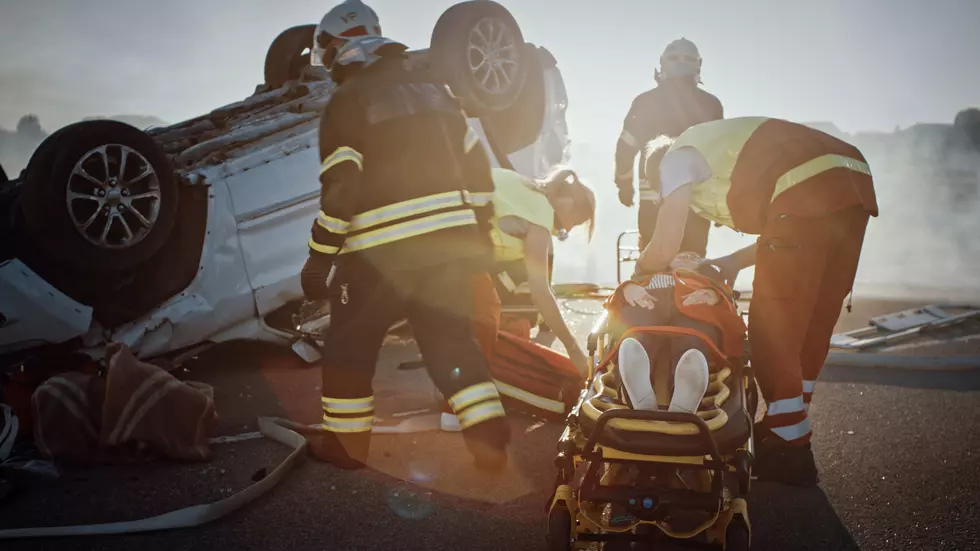
According to the Centers for Disease Control and Prevention, nearly 2,400 teens were killed in car crashes in the U.S. in 2019. That's more than six a day.
The CDC says traffic fatalities among 15- to 19-year-olds also resulted in about $4.8 billion in medical and work loss costs for crashes that occurred in 2018.
To determine the safest and least costly driving environments for teens, WalletHub compared the 50 states across three key dimensions -- safety, economic environment, and driving laws -- using 23 key metrics.

Overall, Wyoming ranked second worst on the list behind Montana.
The neighboring states tied for the most teen driver fatalities per 100,000 teens and tied with the Dakotas and Utah for the most teen DUIs per 100,000 teens.
Wyoming also had the most vehicle miles traveled per capita, 16,857, which is 3.2 times more than New York, the state with the fewest at 5,251.
For the full report, visit: https://wallethub.com/edu/best-worst-states-for-teen-drivers/4598
LOOK: See the iconic cars that debuted the year you were born
LOOK: See how much gasoline cost the year you started driving
More From Laramie Live


